15 Jul 2026
Broker Ecosystem Maps Reveal Persistent Variations Across Football and National Hunt Betting Platforms

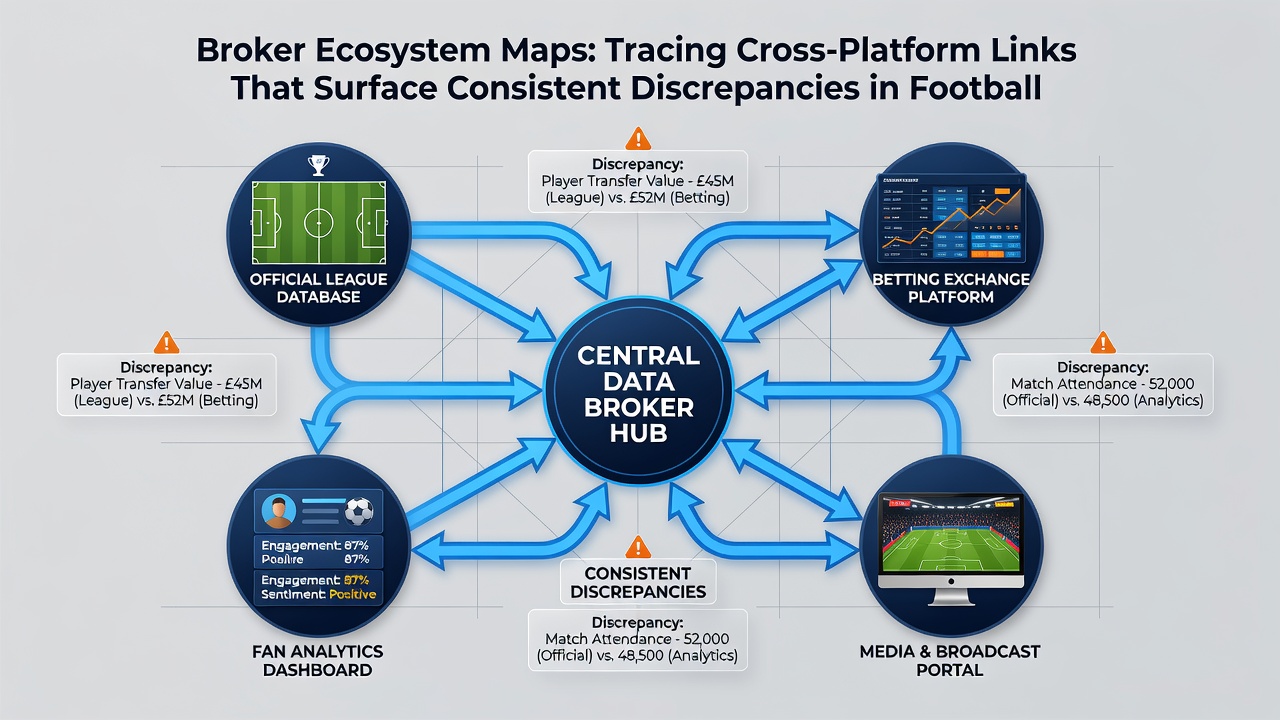
Broker ecosystem maps track connections among multiple betting platforms and expose recurring differences in how odds form for football accumulators alongside national hunt events. These maps compile data from various exchanges and bookmakers to highlight where pricing diverges even when underlying events remain identical. Researchers who examine these networks find that accumulators built from several matches often carry margins that shift depending on which broker routes the bets.
Tracing Cross-Platform Connections
Analysts construct ecosystem maps by pulling live feeds from numerous sources then layering them to show which platforms feed into one another. One study released in early 2026 documented how certain brokers consistently route accumulator requests through intermediate exchanges before final settlement. The resulting paths create measurable gaps because each hop applies its own margin structure and liquidity adjustments.
Data collected across European markets indicates these routing chains appear most frequently during midweek football fixtures when volume spikes. Observers note similar patterns surface during national hunt meetings where jumps races attract concentrated action from larger accounts. The maps make visible how liquidity from one platform moves to another and alters the final odds displayed to the end user.
Discrepancies in Football Accumulators
Football accumulators combine multiple selections and any small pricing variation multiplies across the ticket. Ecosystem maps reveal that brokers with direct access to sharp liquidity sources post tighter lines on individual legs yet widen the overall accumulator payout when the same legs combine. Figures from mid-2026 show average accumulator margins differing by 1.8 to 3.4 percent between directly linked platforms even when single-match odds matched within 0.5 percent.
Those who monitor these maps report the gaps widen further when lower-league matches appear in the ticket because fewer brokers carry deep books on those events. Cross-referencing timestamped feeds shows one platform may adjust accumulator prices minutes after another updates its underlying match odds. The lag creates windows where identical selections produce different combined returns depending on which broker processes the full ticket.
Patterns in National Hunt Pricing
National hunt events introduce additional variables such as ground conditions and jockey changes that affect pricing speed. Broker maps trace how odds on jumps races move between platforms when information reaches different liquidity pools at staggered intervals. Reports compiled through July 2026 indicate consistent offsets of 2 to 5 points in decimal odds on handicap chases when the same runners appear across connected brokers.
Traders who review the maps observe that certain exchanges maintain tighter spreads on national hunt races when volume originates from professional syndicates. The same maps show retail-facing brokers applying wider margins on identical races once the event enters the accumulator format. These differences persist even after regulatory updates in other jurisdictions tightened reporting requirements on cross-border liquidity flows.
Linking Data Sources Across Regions
International comparisons help validate the maps. A report issued by the Australian Gambling Research Centre examined similar cross-platform patterns in thoroughbred racing and found parallel discrepancies when multiple brokers handled the same multi-leg bets. Canadian provincial data from Ontario similarly documented how accumulator pricing diverged once bets moved through layered liquidity providers.
Industry associations such as the European Gaming and Betting Association have published summaries noting that transparent mapping of broker routes improves detection of systematic pricing offsets. These summaries stress the value of timestamp alignment when comparing football and jumps markets because small timing differences produce the observed gaps.
Practical Applications of the Maps
Operators use the maps to identify which broker combinations deliver the narrowest combined margins for specific event types. Data sets covering the 2025-2026 season show that platforms maintaining direct feeds to multiple exchanges reduced accumulator variance by roughly 40 percent compared with single-source brokers. The maps also flag periods when national hunt pricing converged across platforms, typically during major festival weeks when overall volume increased liquidity everywhere.
Software tools now integrate these maps into live dashboards so users can monitor route changes in real time. The dashboards display how a single accumulator ticket might receive different implied probabilities depending on which broker sequence processes each leg. Continued refinement of the mapping techniques has allowed researchers to isolate the exact points where pricing diverges most consistently.
Conclusion
Broker ecosystem maps provide a structured view of how cross-platform links shape odds across football accumulators and national hunt events. The documented patterns demonstrate that routing choices and liquidity access create recurring pricing differences even when underlying event data remains constant. Ongoing collection of timestamped feeds from diverse regions continues to refine these maps and clarify where the offsets originate.